Note
Click here to download the full example code
Scalar dynamic ROM Twin evaluation example#
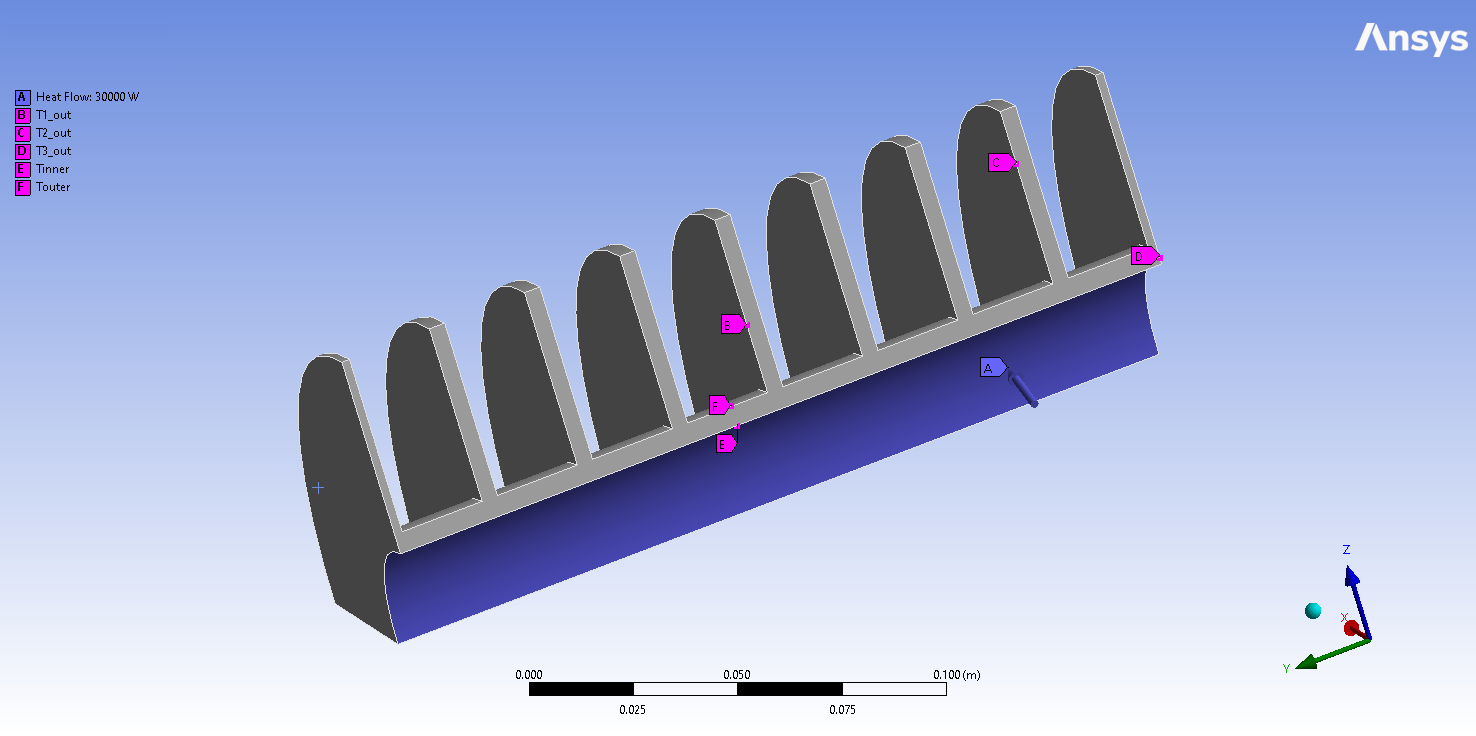
This example shows how you can use PyTwin to load and evaluate a Twin model. The model is a scalar dynamic ROM created out of a 3D thermal model of a Heat Exchanger, having a heat flow as input and three temperature probes as outputs. The example shows a workflow for what-if analysis by deploying a second twin in parallel while simulating the original twin and comparing the different predictions. This is done using the specific functions for saving and loading the twin states. It also illustrates the usage of modify_pytwin_working_dir to change the default working directory location (%temp%) to a user specified location where the different logging files will be available.
# sphinx_gallery_thumbnail_path = '_static/scalarDROM.png'
Perform required imports#
Perform required imports, which includes downloading and importing the input files
Auxiliary functions definition#
Post processing for results comparison.
def plot_result_comparison(step_by_step_results: pd.DataFrame, what_if: pd.DataFrame):
    """Compare the results obtained from 2 different simulations executed on the same TwinModel.
    The 2 results dataset are provided as Pandas Dataframe. The function will plot the different results for all the
    outputs"""
    pd.set_option("display.precision", 12)
    pd.set_option("display.max_columns", 20)
    pd.set_option("display.expand_frame_repr", False)

    # Plotting the runtime outputs
    columns = step_by_step_results.columns[1::]
    columns_what_if = what_if.columns[1::]
    result_sets = 1  # Results from only step-by-step + what-if analysis
    fig, ax = plt.subplots(ncols=result_sets, nrows=len(columns), figsize=(18, 7))
    if len(columns) == 1:
        single_column = True
    else:
        single_column = False

    fig.subplots_adjust(hspace=0.5)
    fig.set_tight_layout({"pad": 0.0})

    for ind, col_name in enumerate(columns):
        # Plot runtime results
        axes0 = ax[ind]

        step_by_step_results.plot(x=0, y=col_name, ax=axes0, ls=":", color="g")
        axes0.legend(loc=2)
        axes0.set_xlabel("Time [s]")

        # Plot Twin what-if analysis results
        what_if.plot(x=0, y=columns_what_if[ind], ax=axes0, ls="-.", color="g", title="Twin Runtime - What if analysis")

        if ind > 0:
            axes0.set_title("")

    # Show plot
    plt.show()
Defining external files path#
Changing the working directory (by default in %temp%) to user defined location, and loading the input data
modify_pytwin_working_dir(os.path.join(os.path.dirname(twin_file), "pyTwinWorkingDir"))

twin_model_input_df = load_data(csv_input)
data_dimensions = twin_model_input_df.shape
number_of_datapoints = data_dimensions[0] - 1
Loading the Twin Runtime and instantiating it#
Loading the Twin Runtime and instantiating it.
Loading model: C:\Users\ansys\AppData\Local\Temp\TwinExamples\twin_files\HX_scalarDRB_23R1_other.twin
Setting up the initial settings of the Twin and initializing it#
Defining the initial inputs of the Twin, initializing it and collecting the initial outputs values
Step by step simulation mode#
Looping over all the input data, simulating the Twin one time step at a time and collecting corresponding outputs
sim_output_list_step = [outputs]
sim_what_if_output_list_step = []
data_index = 0
while data_index < number_of_datapoints:
    if data_index == int(number_of_datapoints / 4) and twin_model_what_if is None:
        # Save the original model's current states
        twin_model.save_state()
        # Instantiate a new TwinModel with same twin file and load the saved state
        twin_model_what_if = TwinModel(twin_file)
        twin_model_what_if.load_state(model_id=twin_model.id, evaluation_time=twin_model.evaluation_time)
        sim_what_if_output_list_step.append(outputs)

    # Gets the stop time of the current simulation step
    time_end = twin_model_input_df.iloc[data_index + 1][0]
    step = time_end - twin_model.evaluation_time
    inputs = dict()
    for column in twin_model_input_df.columns[1::]:
        inputs[column] = twin_model_input_df[column][data_index]
    twin_model.evaluate_step_by_step(step_size=step, inputs=inputs)
    outputs = [twin_model.evaluation_time]
    for item in twin_model.outputs:
        outputs.append(twin_model.outputs[item])
    sim_output_list_step.append(outputs)
    if twin_model_what_if is not None:
        inputs = dict()
        for column in twin_model_input_df.columns[1::]:
            inputs[column] = (
                twin_model_input_df[column][data_index] * 0.9
            )  # the second Twin will be evaluated using same inputs reduced by 10%
        twin_model_what_if.evaluate_step_by_step(step_size=step, inputs=inputs)
        outputs = [twin_model_what_if.evaluation_time]
        for item in twin_model_what_if.outputs:
            outputs.append(twin_model_what_if.outputs[item])
        sim_what_if_output_list_step.append(outputs)
    data_index += 1
results_step_pd = pd.DataFrame(sim_output_list_step, columns=["Time"] + list(twin_model.outputs), dtype=float)

outputs_names = list(twin_model.outputs)
output_names_parallel = []
for i in range(0, len(outputs_names)):
    output_names_parallel.append(outputs_names[i] + " - what-if : load reduced by 10%")
results_what_if_step_pd = pd.DataFrame(
    sim_what_if_output_list_step, columns=["Time"] + output_names_parallel, dtype=float
)
Post processing#
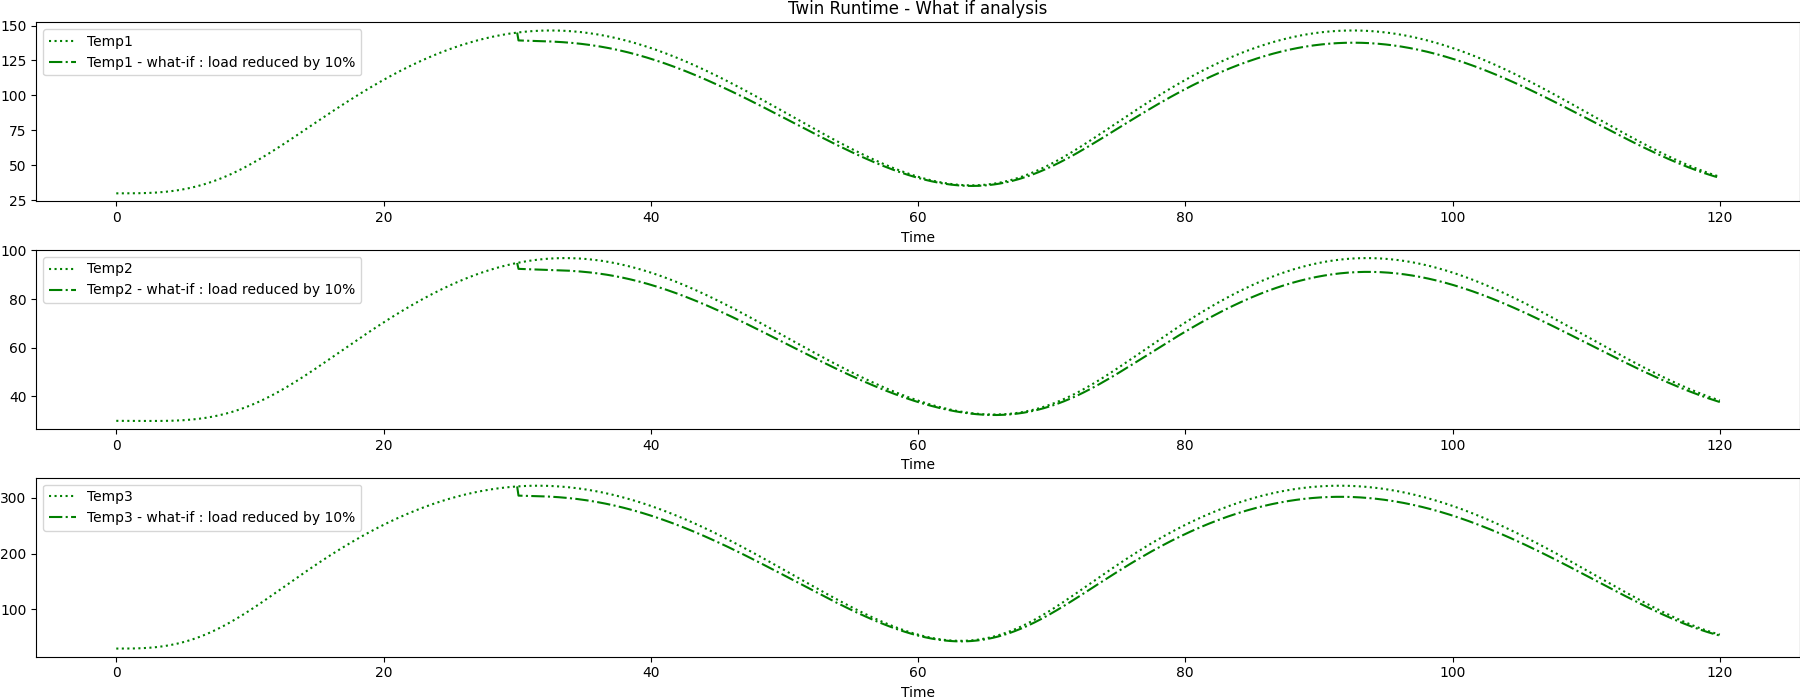
Plotting the different results and saving the image on disk
plot_result_comparison(results_step_pd, results_what_if_step_pd)
Total running time of the script: ( 0 minutes 5.813 seconds)