Note
Click here to download the full example code
Twin evaluation example#
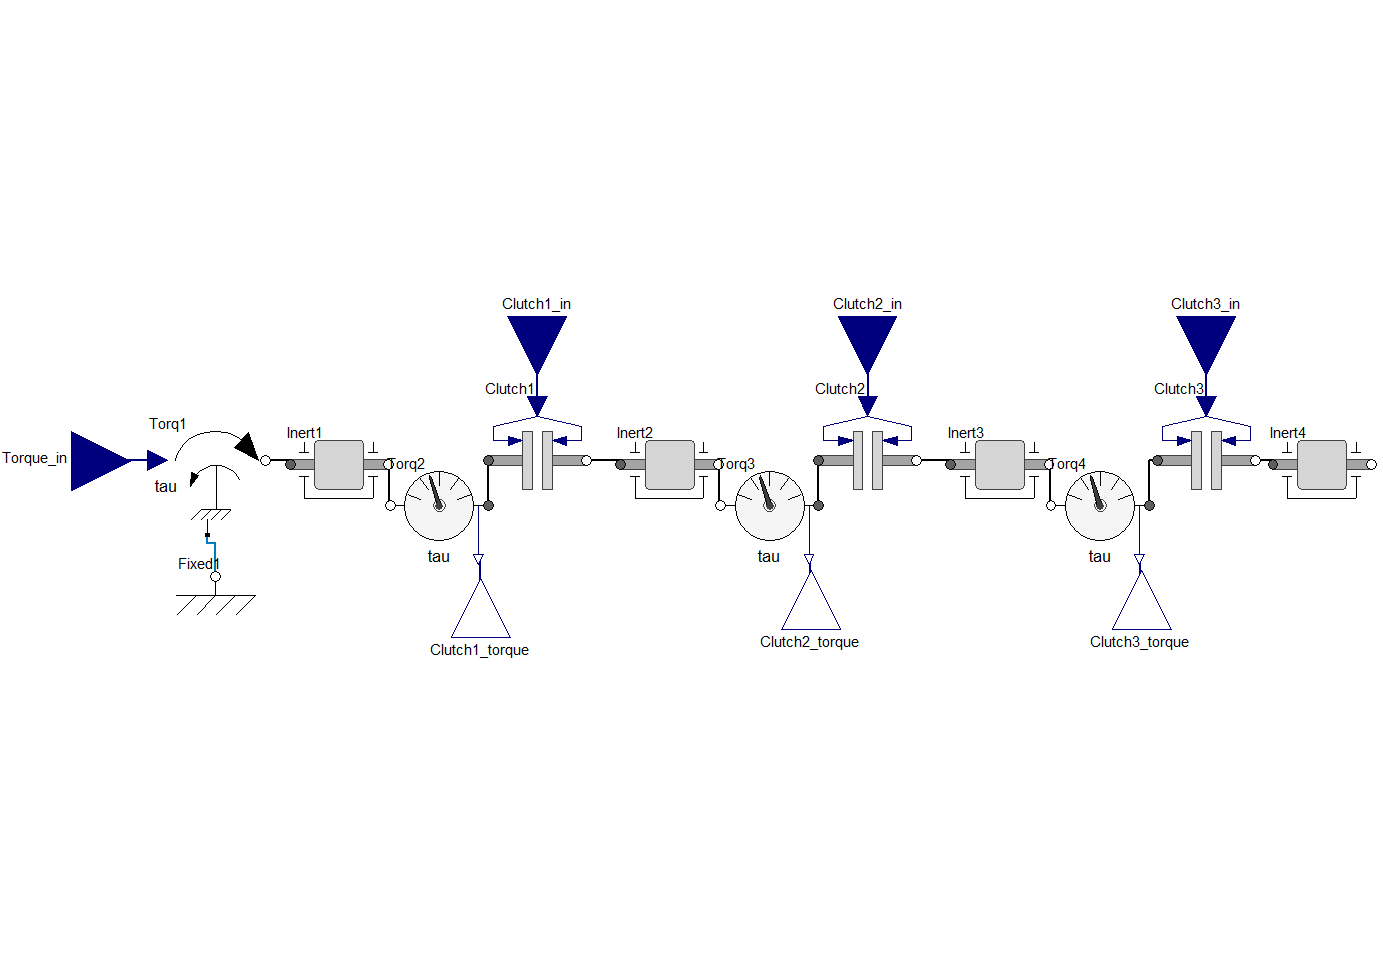
This example shows how you can use PyTwin to load and evaluate a Twin model. The model consists in a coupled clutches with 4 inputs (applied torque, 3 clutches opening) and 3 outputs (computed torque on each of the clutches)
# sphinx_gallery_thumbnail_path = '_static/coupledClutches.png'
Perform required imports#
Perform required imports, which includes downloading and importing the input files
import matplotlib.pyplot as plt
import pandas as pd
from pytwin import TwinModel, download_file, load_data

twin_file = download_file("CoupledClutches_23R1_other.twin", "twin_files")
csv_input = download_file("CoupledClutches_input.csv", "twin_input_files")
twin_config = download_file("CoupledClutches_config.json", "twin_input_files")
Auxiliary functions definition#
Post processing for results comparison.
def plot_result_comparison(step_by_step_results: pd.DataFrame, batch_results: pd.DataFrame):
    """Compare the results obtained from 2 different simulations executed
    on the same TwinModel. The 2 results dataset are provided as Pandas
    Dataframe. The function will plot the different results for all the
    outputs"""
    pd.set_option("display.precision", 12)
    pd.set_option("display.max_columns", 20)
    pd.set_option("display.expand_frame_repr", False)

    # Plotting the runtime outputs
    columns = step_by_step_results.columns[1::]
    result_sets = 2  # Results from only step-by-step, batch_mode
    fig, ax = plt.subplots(ncols=result_sets, nrows=len(columns), figsize=(18, 7))
    if len(columns) == 1:
        single_column = True
    else:
        single_column = False

    fig.subplots_adjust(hspace=0.5)
    fig.set_tight_layout({"pad": 0.0})

    for ind, col_name in enumerate(columns):
        # Plot runtime results
        if single_column:
            axes0 = ax[0]
            axes1 = ax[1]

        else:
            axes0 = ax[ind, 0]
            axes1 = ax[ind, 1]

        step_by_step_results.plot(x=0, y=col_name, ax=axes0, ls=":", color="g", title="Twin Runtime - Step by Step")
        axes0.legend(loc=2)
        axes0.set_xlabel("Time [s]")

        # Plot Twin batch mode csv results
        batch_results.plot(x=0, y=col_name, ax=axes1, ls="-.", color="g", title="Twin Runtime - Batch Mode")
        axes1.legend(loc=2)
        axes1.set_xlabel("Time [s]")

        if ind > 0:
            axes0.set_title("")
            axes1.set_title("")

    # Show plot
    plt.show()
Loading the Twin Runtime and external CSV file#
Loading the Twin Runtime and instantiating it.
print("Loading model: {}".format(twin_file))
twin_model = TwinModel(twin_file)
twin_model_input_df = load_data(csv_input)
data_dimensions = twin_model_input_df.shape
number_of_datapoints = data_dimensions[0] - 1
Loading model: C:\Users\ansys\AppData\Local\Temp\TwinExamples\twin_files\CoupledClutches_23R1_other.twin
Setting up the initial settings of the Twin and initializing it#
Defining the initial inputs of the Twin, initializing it and collecting the initial outputs values
Step by step simulation mode#
Looping over all the input data, simulating the Twin one time step at a time and collecting corresponding outputs
sim_output_list_step = [outputs]
data_index = 0
while data_index < number_of_datapoints:
    # Gets the stop time of the current simulation step
    time_end = twin_model_input_df.iloc[data_index + 1][0]
    step = time_end - twin_model.evaluation_time
    inputs = dict()
    for column in twin_model_input_df.columns[1::]:
        inputs[column] = twin_model_input_df[column][data_index]
    twin_model.evaluate_step_by_step(step_size=step, inputs=inputs)
    outputs = [twin_model.evaluation_time]
    for item in twin_model.outputs:
        outputs.append(twin_model.outputs[item])
    sim_output_list_step.append(outputs)
    data_index += 1
results_step_pd = pd.DataFrame(sim_output_list_step, columns=["Time"] + list(twin_model.outputs), dtype=float)
Batch simulation mode#
Resetting/re-initializing the Twin and running it in batch mode (i.e. passing all the input data, simulating all the data points, and collecting all the outputs at once)
data_index = 0
inputs = dict()
for column in twin_model_input_df.columns[1::]:
    inputs[column] = twin_model_input_df[column][data_index]
twin_model.initialize_evaluation(inputs=inputs, json_config_filepath=twin_config)
outputs = [twin_model.evaluation_time]
for item in twin_model.outputs:
    outputs.append(twin_model.outputs[item])
results_batch_pd = twin_model.evaluate_batch(twin_model_input_df)
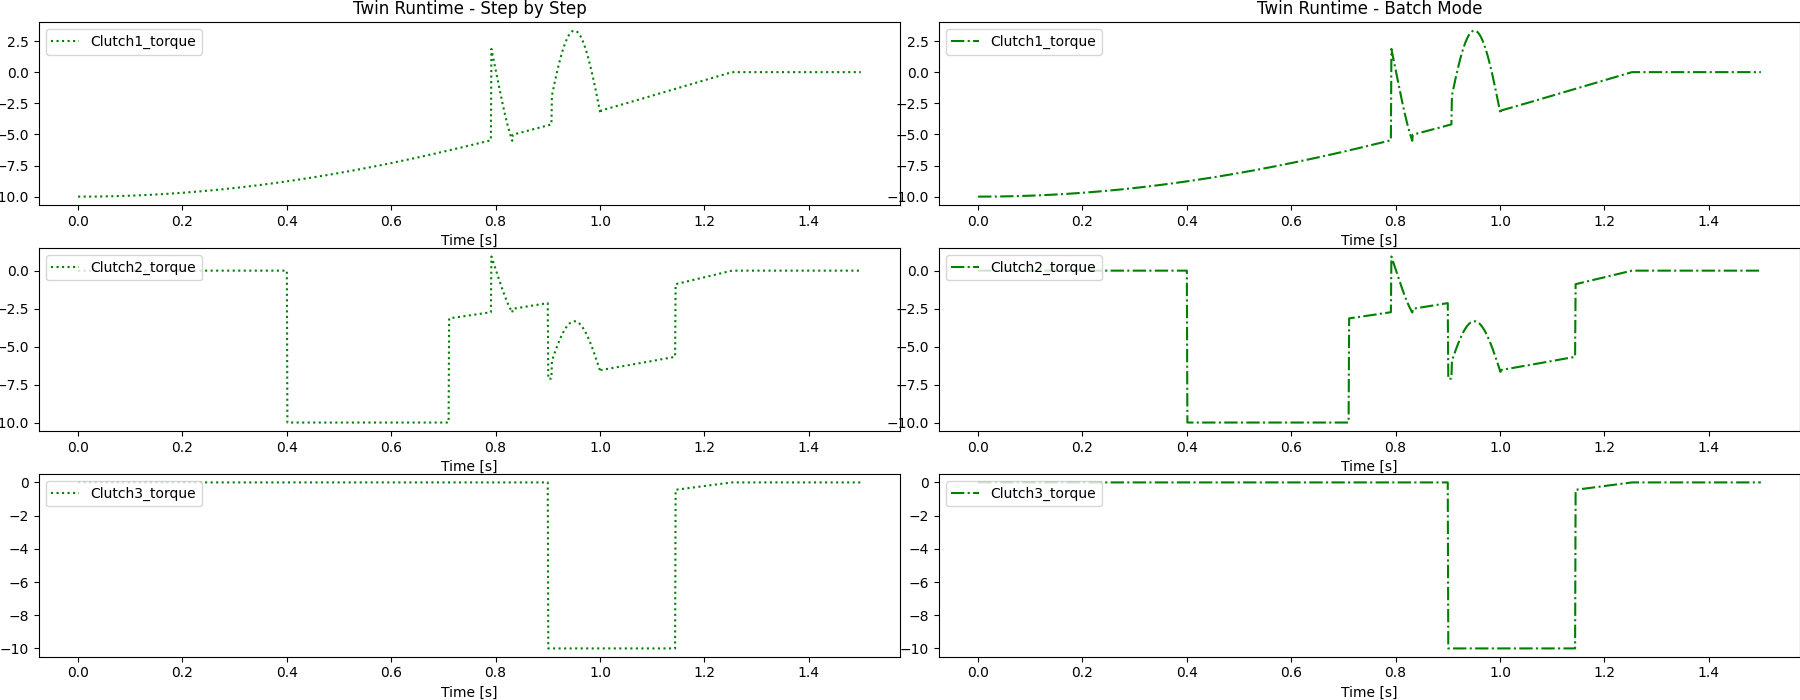
Post processing#
Plotting the different results and saving the image on disk
plot_result_comparison(results_step_pd, results_batch_pd)
Total running time of the script: ( 0 minutes 7.581 seconds)